Economic Impact Report
Overview
The Economic Impact Report is a self-serve attribution reporting tool built for Destination Marketing Organisation (DMOs) clients. It quantifies the real-world impact of Sojern's advertising by measuring confirmed traveller visits to a destination following ad exposure, giving DMOs a data-backed view of the return on their marketing investment.
Problem
DMOs operate differently from airlines or hotels, they don't capture direct bookings on their own platforms and have no built-in attribution framework to measure the impact of their marketing spend. As publicly funded organisations, they are required to justify budgets to boards and stakeholders, making clear evidence of campaign performance critical.
The existing reporting fell short in two significant ways. Practically, DMOs were relying on static PDFs and manual reporting, creating friction and making it difficult to make a compelling case for future marketing investment. But even when data was available, the language and terminology used was dense and technical, making it hard for non-specialist stakeholders to interpret the results with confidence. Jargon-heavy metrics that made sense internally did little to help a board member or a public funder understand what had actually been achieved. This eroded trust in the data itself, and in the teams presenting it.
The existing static PDF report delivered to DMO clients, highlighting the limitations that shaped the brief.
Research
To ground the work, I began with competitive research across other economic impact reports, analysing how comparable tools structure and communicate data to their audiences.
From there, I partnered with the product marketing team to develop a set of customer interview questions. These were used during the EU Destination Advisory Board session, where board members were asked questions covering both overall feedback on the Sojern platform and their experience with the EIR. Alongside the interviews, an initial prototype of the new EIR report was presented to the board, giving customers the opportunity to react to a tangible direction and provide grounded, specific feedback.
All of this qualitative input was synthesised by clustering quotes into themes and distilling them into discrete insights. These insights were then reframed as "How might we..." questions, which became the foundation for ideation and helped ensure further design decisions remained tethered to real user needs throughout the process.
Understanding how DMO clients interpret and use campaign performance data was central to shaping the EIR experience. Key research questions included how clients currently access and share reporting, what metrics matter most to their stakeholders, and where existing reporting fell short of their needs. Findings informed both the data hierarchy within the report and the level of explanatory context needed to help non-technical users interpret the results confidently.
Affinity mapping output — raw quotes clustered into themes and distilled into actionable insights.
Competitive analysis — surveying how comparable economic impact reports structure and communicate data to their audiences.
Solution
A self-serve, in-flight reporting dashboard that gives DMO clients on-demand access to deterministic attribution data, replacing static PDF reports with a dynamic, filterable experience. Clients can filter by date range and campaign, sort table data to surface the metrics most relevant to their needs, and download results for stakeholder presentations. Explanatory footnotes are built into the interface to guide interpretation and reduce reliance on account managers for support.

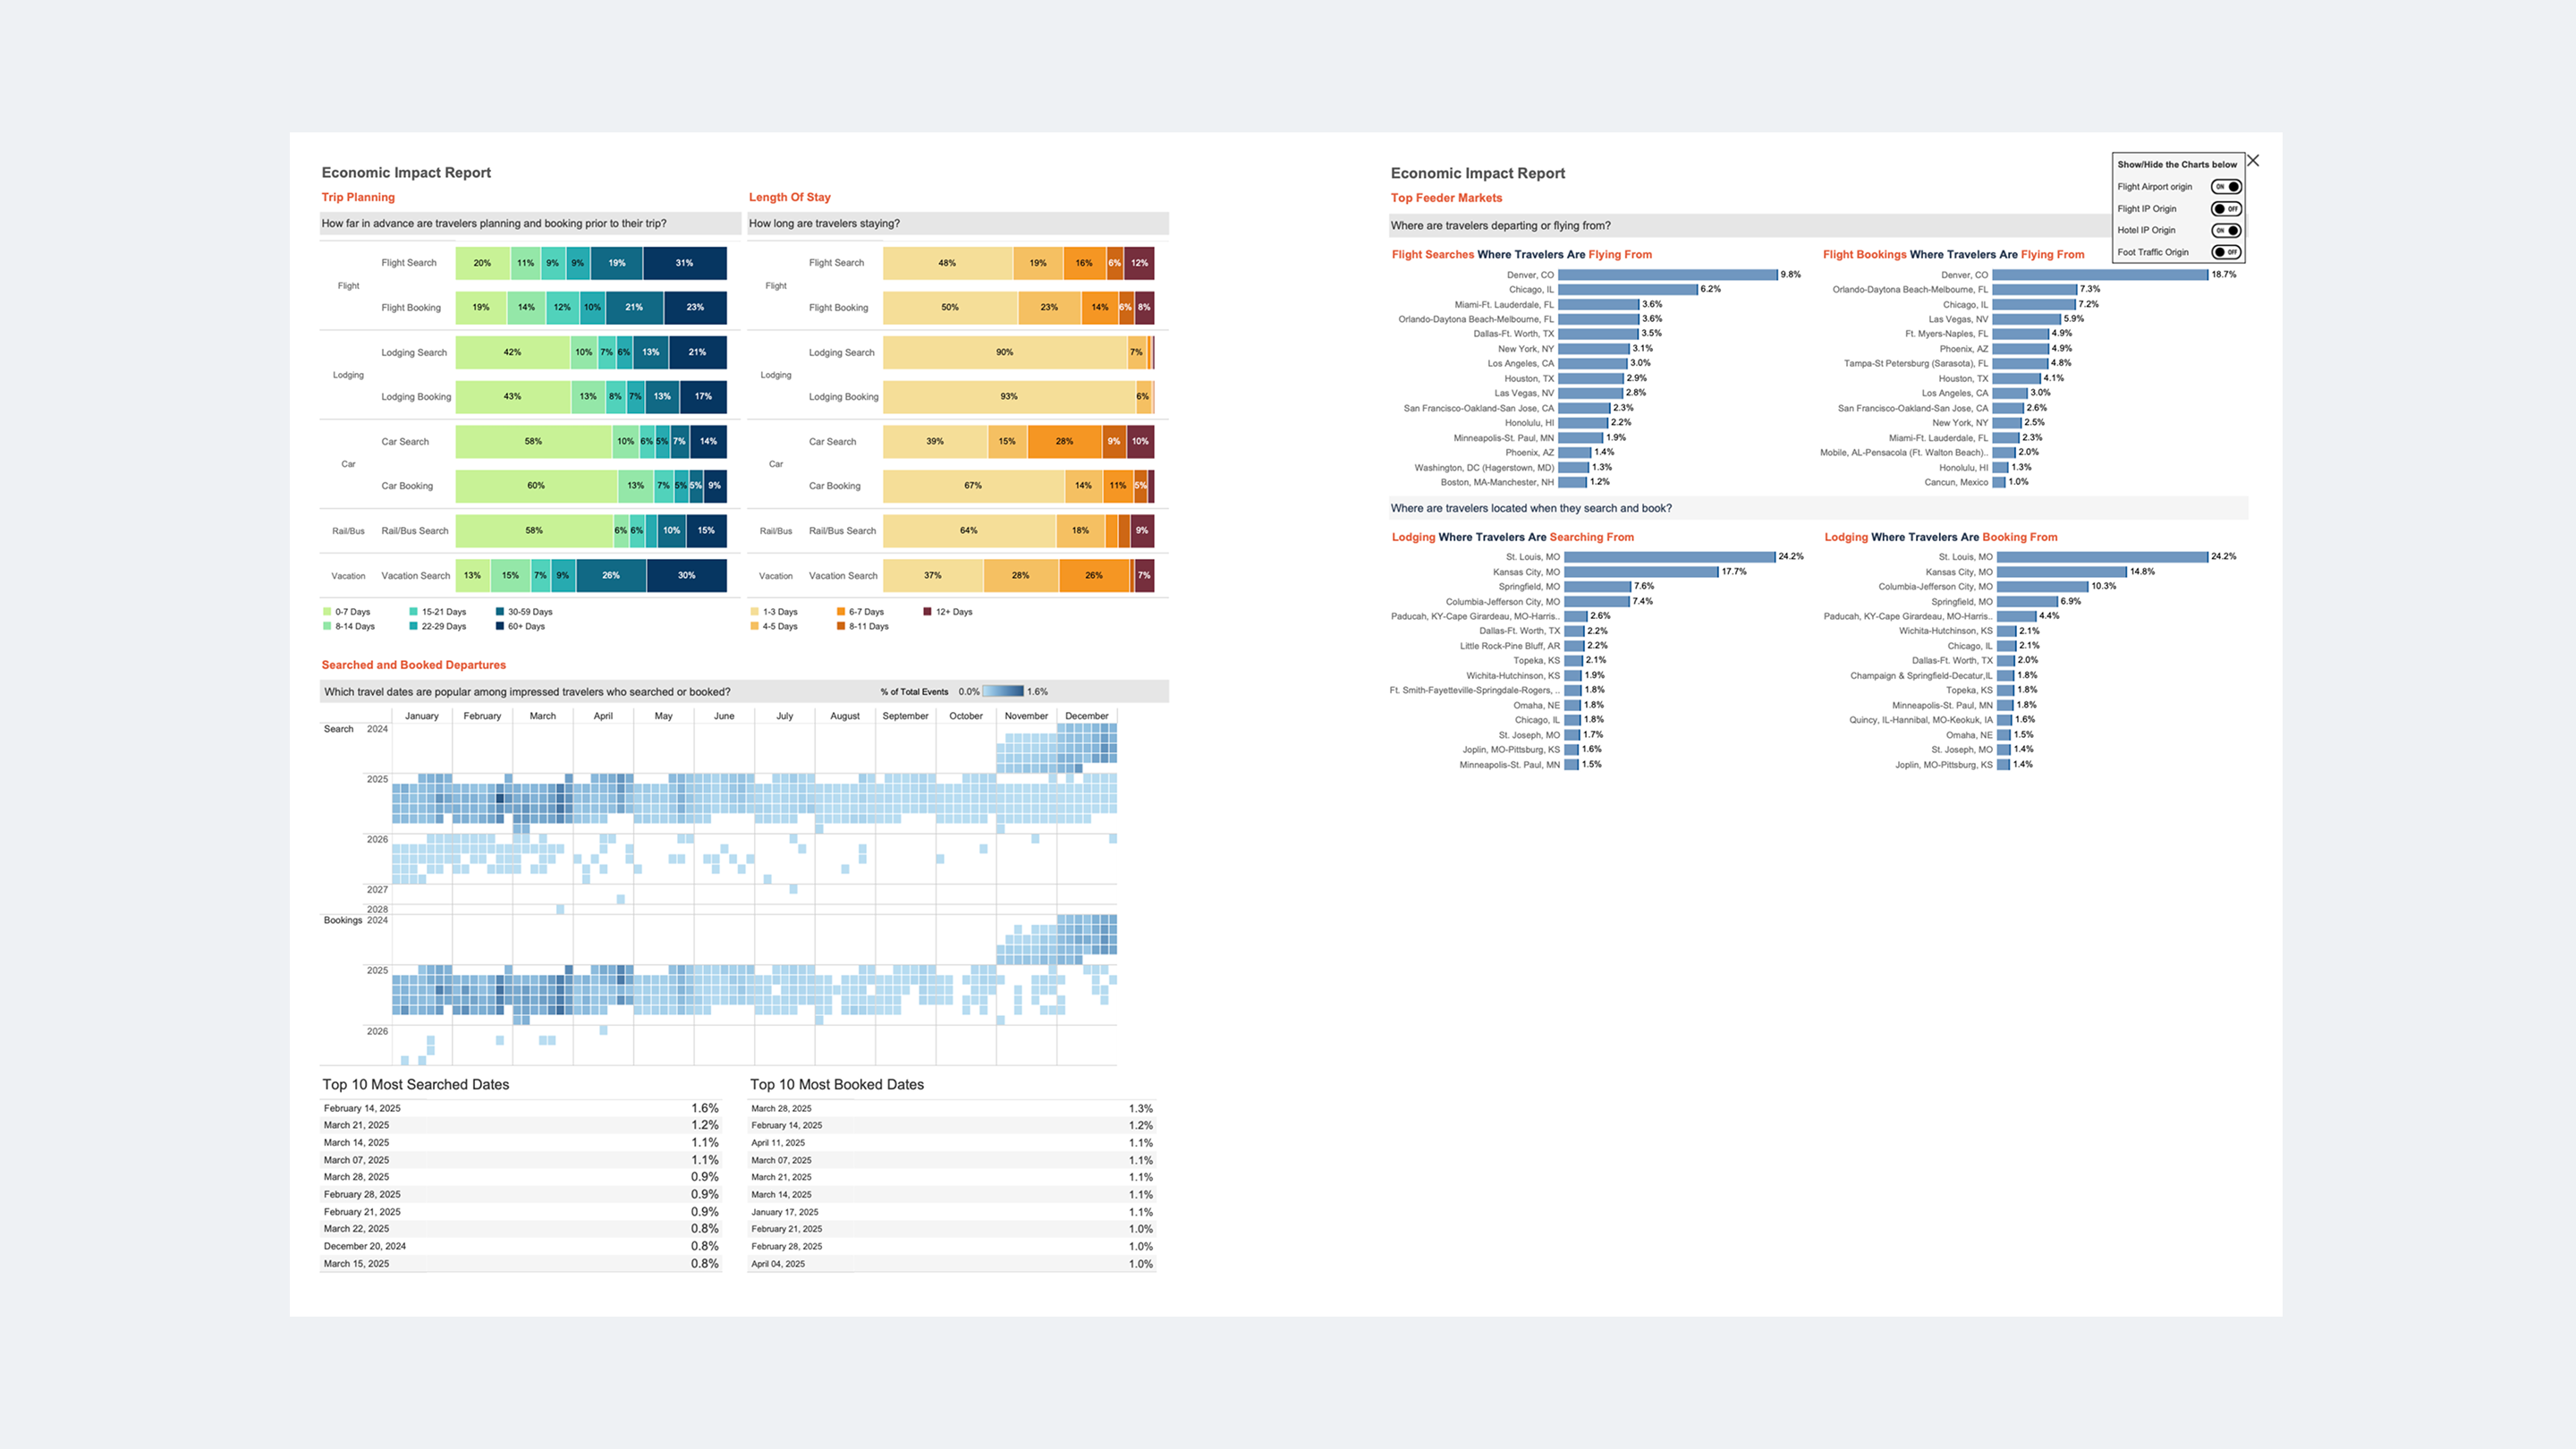
Final design screens showing the EIR dashboard layout and data visualisation approach.
Key user stories illustrated across the dashboard — filtering by date range, sorting metrics, and downloading results.
Design Process
The MVP was scoped to support deterministic reporting only, focusing on the core use case before expanding to more complex segments. The design process involved mapping the end-to-end reporting journey, from how clients access the report through to how they share findings internally, and identifying where clarity, trust, and ease of use were most critical. Given that EIR is often used in board-level presentations, particular attention was paid to how data was labelled, contextualised, and visually communicated to non-technical audiences.
Final Design
The EIR dashboard gives clients a clear, scannable view of campaign attribution data with filtering and sorting controls that put them in charge of their own analysis. Key metrics are surfaced prominently, supported by contextual tooltips that explain methodology and guide interpretation. A download function allows clients to export results directly for use in stakeholder reporting. The interface was designed to feel familiar and trustworthy, reinforcing Sojern's position as a credible measurement partner rather than just an ad platform.
Outcomes
The Economic Impact Report MVP is set to launch in Q2 2026 with a selected beta panel of DMO clients. Working closely with Customer Success Managers, we will gather structured feedback from beta participants to validate the experience, identify areas for improvement, and iterate on the design before full release. Pendo has also been integrated with the report to track usage and adoption, giving the team visibility into how clients are engaging with the product in practice. The insights gathered from beta customers and usage data will feed directly into further "How might we..." brainstorm sessions, allowing the team to continue generating ideas grounded in real usage patterns and evolving client needs. This staged approach ensures the product is grounded in real client usage before it is rolled out more broadly, maintaining the evidence-based approach that shaped the design process from the start.